10 Dashboard drill-down
10.1 Add a tabset to the dashboard
Prepare the ui to accept new tabs based on the user’s input
- Wrap the “output” functions in the ui with a
tabPanel()
# Goes from this
valueBoxOutput("total"),
dataTableOutput("monthly")

# To this
tabPanel(
  valueBoxOutput("total"),
  dataTableOutput("monthly")
)- Set the panel’s
titleandvalue. The new code should look like this
tabPanel(
  title = "Dashboard",
  value = "page1",
  valueBoxOutput("total"),
  dataTableOutput("monthly")
)- Wrap that code inside a
tabsetPanel(), set theidtotabs
tabsetPanel(
  id = "tabs",
  tabPanel(
    title = "Dashboard",
    value = "page1",
    valueBoxOutput("total"),
    dataTableOutput("monthly")
  )
)- Re-run the app
10.2 Add interactivity
Add an click-event that creates a new tab
- Set the
selectionandrownamesin the currentdatatable()function
output$monthly <- renderDataTable(datatable({
  base_dashboard() %>%
    group_by(month) %>%
    tally() %>%
    collect() %>%
    mutate(n = as.numeric(n)) %>%
    rename(flights = n) %>%
    arrange(month)},
  list( target = "cell"),    # New code
rownames = FALSE)) # New code- Use
observeEvent()andappendTab()to add the interactivity
observeEvent(input$monthly_cell_clicked, {
  appendTab(
    inputId = "tabs", # This is the tabsets panel's ID
    tabPanel(
      "test_new", # This will be the label of the new tab
      renderDataTable(mtcars, rownames = FALSE)
    )
  )
})
Re-run the app
Click on a row inside the
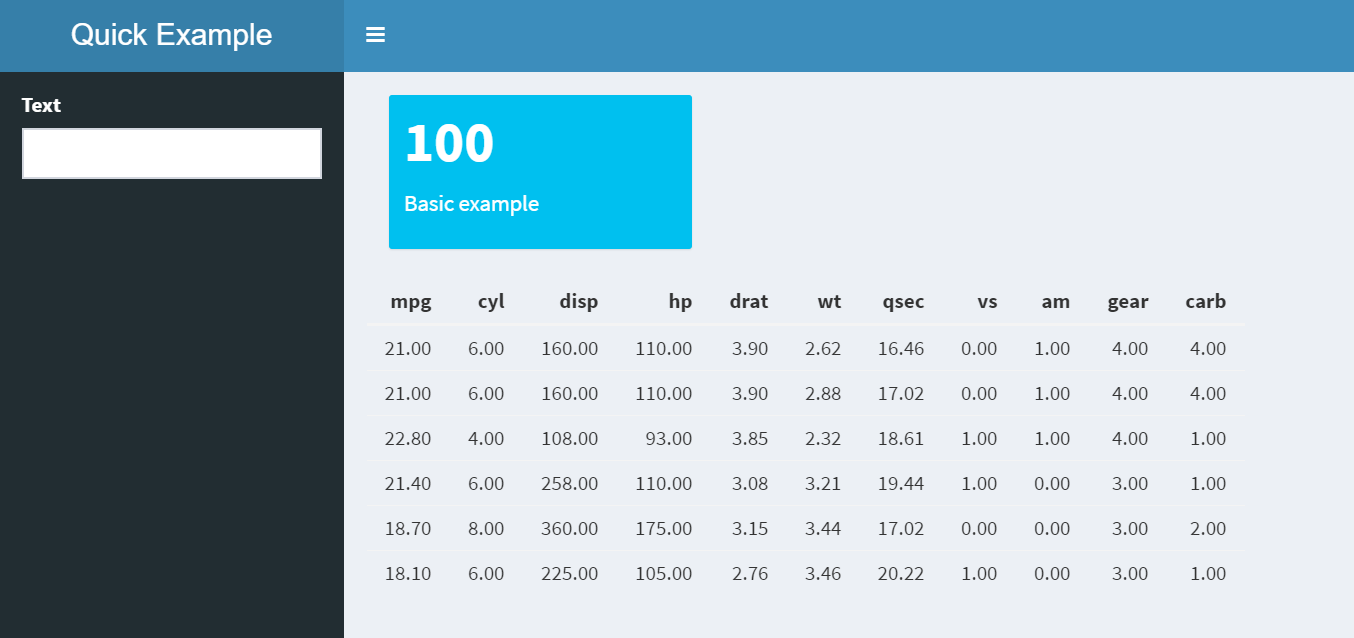
datatableand then select the new tab calledtest_newto see themtcarsdata
10.3 Add title to the new tab
Use the input’s info to create a custom label
- Load the clicked cell’s info into a variable, and create a new lable by concatenating the cell’s month and the selected airline’s code
observeEvent(input$monthly_cell_clicked, {
  cell <- input$monthly_cell_clicked # New code

  if (!is.null(cell$value)) { # New code
    tab_title <- paste0(month.name[cell$value], "_", input$select)
    appendTab(
      inputId = "tabs",
      tabPanel(
        tab_title, # Changed code
        renderDataTable(mtcars, rownames = FALSE)
      )
    )
  }
})
Re-run the app, and click on one of the month’s to confirm that the new label works
Use
updateTabsetPanelto switch the dashboard’s focus to the newly created tab. It goes after thetabPanel()code
updateTabsetPanel(session, "tabs", selected = tab_title)10.4 pool pakcage
Improve connectivity using the pool package
1.Change dbConnect() to dbPool()
# Goes from this
con <- DBI::dbConnect(odbc::odbc(), "Postgres Dev")

# To this
con <- pool::dbPool(odbc::odbc(), dsn = "Postgres Dev")- Add an
onStop()step to close the pool connection
onStop(function() {
  poolClose(con)
})