sparklyr
sparklyr serves as the R interface to Apache Spark, enabling seamless connections to Databricks through Databricks Connect.
What’s new?
Watch Edgar Ruiz’s posit::conf(2023) talk, Using R with Databricks Connect, to learn what’s new with sparklyr and Databricks:
How-to
The Databricks Connect v2 page in the sparklyr documentation has updated, thorough steps on using sparklyr for Databricks. This page links to the relevant sections.
Watch a walkthrough of the steps here:
Install the required packages »
Install the required packages to get started.
install.packages("sparklyr")
install.packages("pysparklyr")
Get started »
Configure your workspace to use Databricks Connect and access Unity Catalog data via the RStudio Connections Pane.
If you’re using RStudio on Posit Workbench, there’s a new Databricks pane that helps you manage your Databricks Spark clusters, as well as connections to clusters via Sparklyr. Click on the Databricks pane, and you’ll see a list of your compute clusters, their status, and more details. Learn more.
Interact with the cluster »
The new integration with sparklyr allows you to explore and access data from your Databricks cluster directly in RStudio through the Connections Pane.
Analyzing your data
Prepare data »
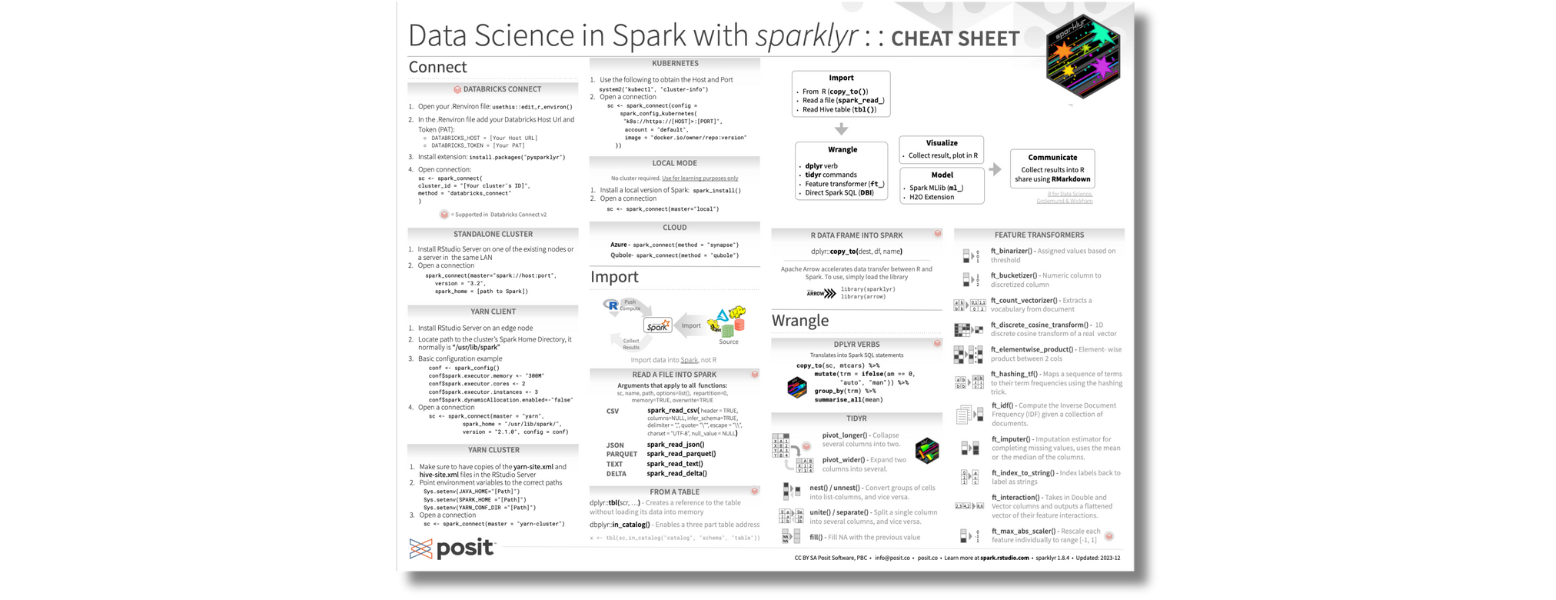
You can use your familiar dplyr commands to prepare your data. The sparklyr cheat sheet provides easy reference to the functions available with sparklyr.
Machine learning »
Sparklyr supports Logistic Regression and two scaler transformers, Standard Scaler and Max Abs Scaler.
Deploying Databricks-backed content to Posit Connect »
Once you have created your content, deploy it to Posit Connect using pysparklyr::deploy_databricks(). Posit Connect allows you to edit sharing permissions, edit vanity URLs, and more.
Tutorial
In our blog post, Crossing Bridges: Reporting on NYC taxi data with RStudio and Databricks, we walk through connecting to Databricks in RStudio, accessing cluster data, and creating a Quarto report using the data that is deployed to Posit Connect.