This documents monitors the model performance. It is refreshed on a daily basis. The following metrics are monitored:
Root Mean Squared Error (RMSE),
R Squared (RSQ), and
Mean Absolute Error (MAE).
Setup
Load the required libraries and evaluation data. The table below is the first five rows of the evaluation data.
Code
library(tidyverse)## ── Attaching packages ─────────────────────────────────────── tidyverse 1.3.1 ──## ✔ ggplot2 3.3.5 ✔ purrr 0.3.4## ✔ tibble 3.1.7 ✔ dplyr 1.0.9## ✔ tidyr 1.2.0 ✔ stringr 1.4.0## ✔ readr 2.0.2 ✔ forcats 0.5.1## ── Conflicts ────────────────────────────────────────── tidyverse_conflicts() ──## ✖ dplyr::filter() masks stats::filter()## ✖ dplyr::lag() masks stats::lag()library(vetiver)library(pins)library(yardstick)## For binary classification, the first factor level is assumed to be the event.## Use the argument `event_level = "second"` to alter this as needed.## ## Attaching package: 'yardstick'## The following object is masked from 'package:readr':## ## speclibrary(glue)library(kableExtra)## ## Attaching package: 'kableExtra'## The following object is masked from 'package:dplyr':## ## group_rowsboard <- pins::board_rsconnect()## Connecting to RSC 2023.10.0 at <https://colorado.posit.co/rsc>v <-vetiver_pin_read(board, params$name, version = params$version)v_meta <-pin_meta(board, params$name)con <- odbc::dbConnect(odbc::odbc(), "Content DB", timeout =10)bike_model_data <-tbl(con, "bike_model_data")train_start_date <- lubridate::as_date(v$metadata$user$train_dates[1])train_end_date <- lubridate::as_date(v$metadata$user$train_dates[2])test_start_date <- lubridate::as_date(v$metadata$user$test_dates[1])test_end_date <- lubridate::as_date(v$metadata$user$test_dates[2])test_data <- bike_model_data %>%filter( date >= train_start_date, date <= train_end_date ) %>%collect()test_data %>%head() %>%kable() %>%kable_material()
id
hour
date
month
dow
n_bikes
lat
lon
101
10
2023-07-23
7
Sunday
11
38.89483
-76.98763
101
10
2023-07-24
7
Monday
13
38.89483
-76.98763
101
10
2023-07-25
7
Tuesday
22
38.89483
-76.98763
101
10
2023-07-26
7
Wednesday
16
38.89483
-76.98763
101
10
2023-07-27
7
Thursday
14
38.89483
-76.98763
101
10
2023-07-28
7
Friday
11
38.89483
-76.98763
Compute metrics
Use vetiver to compute the latest evaluation metrics. The metrics are stored as a pin on RStudio Connect. The table below is the first 5 rows of the evaluation metrics
Code
## compute predictions for your evaluation data## `handler_startup` is designed to get the R process ready to make predictionssuppressPackageStartupMessages(handler_startup(v))# Specifically load the packages required by the model. Check # `v$metadata$required_pkgs` to see the required pacakges. These packages must# be specicially defined so that RStudio Connect knows to install them when# deploying this document.library(parsnip)library(ranger)library(recipes)## ## Attaching package: 'recipes'## The following object is masked from 'package:stringr':## ## fixed## The following object is masked from 'package:stats':## ## steplibrary(workflows)library(slider)preds <-augment(v, test_data)latest_metrics <- preds %>%arrange(date) %>%vetiver_compute_metrics(date_var = date,period ="day",truth = n_bikes,estimate = .pred )pin_name <-"sam.edwardes/bike-predict-model-metrics"if (pin_exists(board, pin_name)) {print("Pin already exists, updating existing pin...")vetiver_pin_metrics(board, latest_metrics, pin_name, overwrite =TRUE)} else {print("Creating metrics pin for the first time...")pin_write(board, latest_metrics, pin_name)}## [1] "Pin already exists, updating existing pin..."## Guessing `type = 'rds'`## Writing to pin 'sam.edwardes/bike-predict-model-metrics'## # A tibble: 873 × 5## .index .n .metric .estimator .estimate## <date> <int> <chr> <chr> <dbl>## 1 2022-06-17 6872 rmse standard 3.45 ## 2 2022-06-17 6872 rsq standard 0.699## 3 2022-06-17 6872 mae standard 2.65 ## 4 2022-06-18 8172 rmse standard 3.43 ## 5 2022-06-18 8172 rsq standard 0.666## 6 2022-06-18 8172 mae standard 2.64 ## 7 2022-06-19 8172 rmse standard 3.52 ## 8 2022-06-19 8172 rsq standard 0.647## 9 2022-06-19 8172 mae standard 2.75 ## 10 2022-06-20 8172 rmse standard 3.42 ## # … with 863 more rowsall_time_metrics <-pin_read(board, pin_name)all_time_metrics %>%head() %>%kable() %>%kable_material()
.index
.n
.metric
.estimator
.estimate
2022-06-17
6872
rmse
standard
3.4533047
2022-06-17
6872
rsq
standard
0.6985257
2022-06-17
6872
mae
standard
2.6482618
2022-06-18
8172
rmse
standard
3.4253559
2022-06-18
8172
rsq
standard
0.6655180
2022-06-18
8172
mae
standard
2.6446323
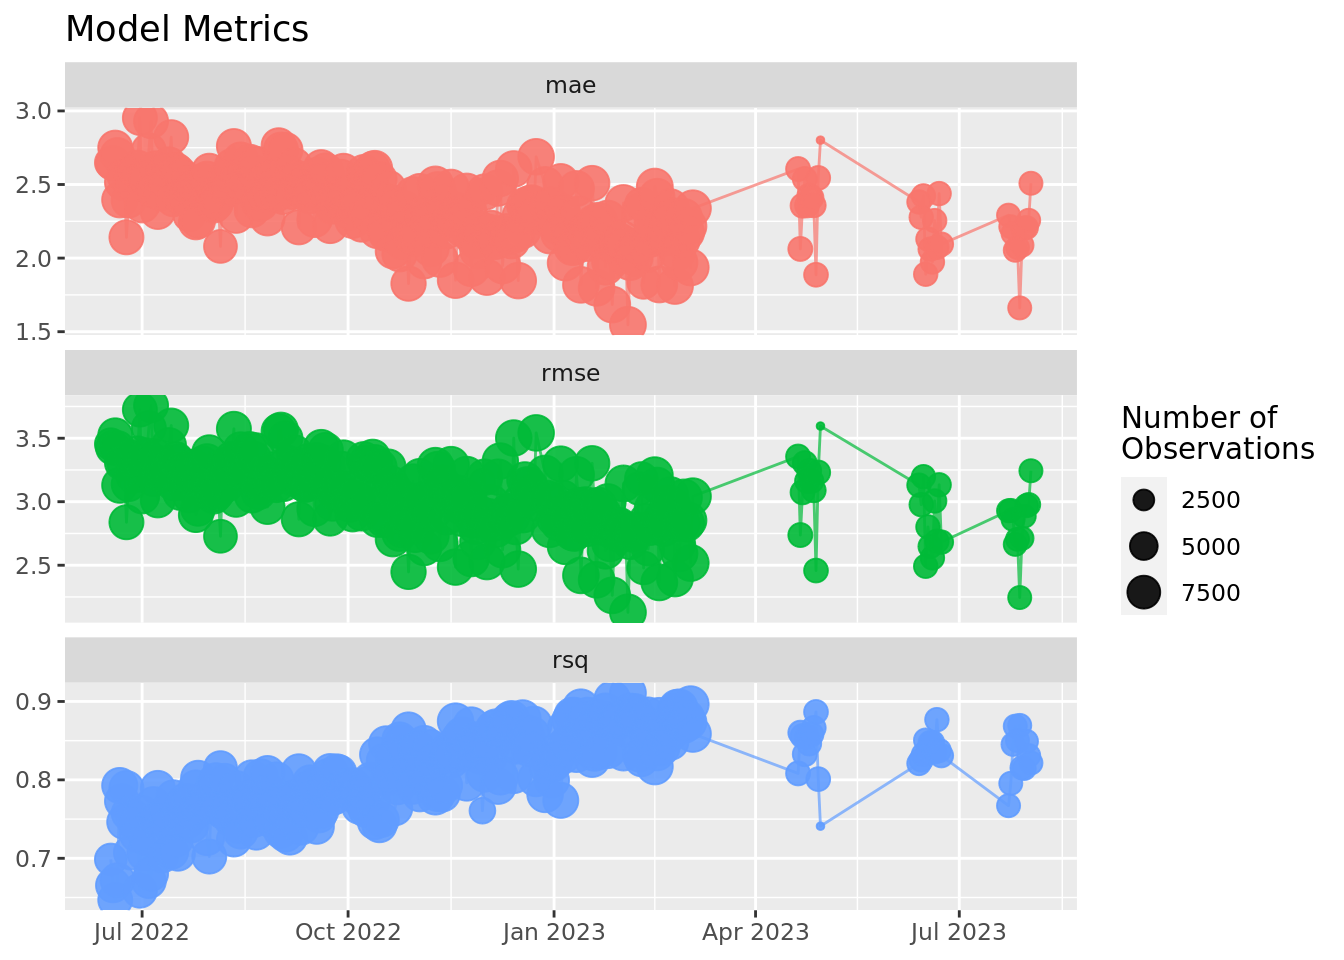
Visualize metrics
Use vetiver to visualize the all time model metrics.
---title: "Model Step 3 - Model Metrics"date: "`r lubridate::date(lubridate::now(tzone = 'EST'))`"format: html: code-fold: true code-tools: source: true toggle: trueparams: name: sam.edwardes/bike_predict_model_r version: NULL---## BackgroundThis documents monitors the model performance. It is refreshed on a daily basis. The following metrics are monitored:- Root Mean Squared Error (RMSE),- R Squared (RSQ), and- Mean Absolute Error (MAE).## SetupLoad the required libraries and evaluation data. The table below is the first five rows of the evaluation data.```{r setup}#| collapse: truelibrary(tidyverse)library(vetiver)library(pins)library(yardstick)library(glue)library(kableExtra)board <- pins::board_rsconnect()v <-vetiver_pin_read(board, params$name, version = params$version)v_meta <-pin_meta(board, params$name)con <- odbc::dbConnect(odbc::odbc(), "Content DB", timeout =10)bike_model_data <-tbl(con, "bike_model_data")train_start_date <- lubridate::as_date(v$metadata$user$train_dates[1])train_end_date <- lubridate::as_date(v$metadata$user$train_dates[2])test_start_date <- lubridate::as_date(v$metadata$user$test_dates[1])test_end_date <- lubridate::as_date(v$metadata$user$test_dates[2])test_data <- bike_model_data %>%filter( date >= train_start_date, date <= train_end_date ) %>%collect()test_data %>%head() %>%kable() %>%kable_material()```## Compute metricsUse vetiver to compute the latest evaluation metrics. The metrics are stored as a pin on RStudio Connect. The table below is the first 5 rows of the evaluation metrics```{r compute_metrics}#| collapse: true## compute predictions for your evaluation data## `handler_startup` is designed to get the R process ready to make predictionssuppressPackageStartupMessages(handler_startup(v))# Specifically load the packages required by the model. Check # `v$metadata$required_pkgs` to see the required pacakges. These packages must# be specicially defined so that RStudio Connect knows to install them when# deploying this document.library(parsnip)library(ranger)library(recipes)library(workflows)library(slider)preds <-augment(v, test_data)latest_metrics <- preds %>%arrange(date) %>%vetiver_compute_metrics(date_var = date,period ="day",truth = n_bikes,estimate = .pred )pin_name <-"sam.edwardes/bike-predict-model-metrics"if (pin_exists(board, pin_name)) {print("Pin already exists, updating existing pin...")vetiver_pin_metrics(board, latest_metrics, pin_name, overwrite =TRUE)} else {print("Creating metrics pin for the first time...")pin_write(board, latest_metrics, pin_name)}all_time_metrics <-pin_read(board, pin_name)all_time_metrics %>%head() %>%kable() %>%kable_material()```## Visualize metricsUse vetiver to visualize the all time model metrics.```{r plot_metrics}vetiver_plot_metrics(all_time_metrics) +labs(title ="Model Metrics",size ="Number of\nObservations" )```