A model card provides brief, transparent, responsible reporting for a trained machine learning model. Expand the code chunk below to inspect the code that loads the model, training data, and evaluation data.
Code
library(tidyverse)## ── Attaching packages ─────────────────────────────────────── tidyverse 1.3.1 ──## ✔ ggplot2 3.3.5 ✔ purrr 0.3.4## ✔ tibble 3.1.7 ✔ dplyr 1.0.9## ✔ tidyr 1.2.0 ✔ stringr 1.4.0## ✔ readr 2.0.2 ✔ forcats 0.5.1## ── Conflicts ────────────────────────────────────────── tidyverse_conflicts() ──## ✖ dplyr::filter() masks stats::filter()## ✖ dplyr::lag() masks stats::lag()library(vetiver)library(pins)library(yardstick)## For binary classification, the first factor level is assumed to be the event.## Use the argument `event_level = "second"` to alter this as needed.## ## Attaching package: 'yardstick'## The following object is masked from 'package:readr':## ## speclibrary(glue)library(kableExtra)## ## Attaching package: 'kableExtra'## The following object is masked from 'package:dplyr':## ## group_rowsboard <- pins::board_rsconnect()## Connecting to RSC 2024.02.0 at <https://colorado.posit.co/rsc>v <-vetiver_pin_read(board, params$name, version = params$version)v_meta <-pin_meta(board, params$name)con <- odbc::dbConnect(odbc::odbc(), "Content DB", timeout =10)bike_model_data <-tbl(con, "bike_model_data")train_start_date <- lubridate::as_date(v$metadata$user$train_dates[1])train_end_date <- lubridate::as_date(v$metadata$user$train_dates[2])test_start_date <- lubridate::as_date(v$metadata$user$test_dates[1])test_end_date <- lubridate::as_date(v$metadata$user$test_dates[2])data <- bike_model_data %>%filter(date >= train_start_date) %>%collect() %>%mutate(data_type =case_when( date <= train_end_date ~"train", date <= test_end_date ~"test",TRUE~"latest" ) )train_data <- data %>%filter(data_type =="train")test_data <- data %>%filter(data_type =="test")
Model details
Developed by Sam Edwardes (RStudio - Solutions Engineer)
A ranger regression modeling workflow using 7 features
This model was developed to predict how many capital bikeshare bikes will be available for a given station based on the time of day, and day of the week.
The primary intended use of this model is to demonstrate an end-to-end data science workflow using RStudio Connect.
Metrics
The metrics used to evaluate this model are:
Root Mean Squared Error (RMSE),
R Squared (RSQ), and
Mean Absolute Error (MAE).
We chose these metrics because because they are the most common metrics for assessing the performance of regression models, and that they are well understood by the data science community.
Overall model performance against the model evaluation data.
Code
# Explicitly define packages used for model metrics by vetiver so that Connect # is able to redeploy.library(slider)latest_metrics %>%kable() %>%kable_material()
.index
.n
.metric
.estimator
.estimate
2023-08-03
3192
rmse
standard
4.2824583
2023-08-03
3192
rsq
standard
0.3313428
2023-08-03
3192
mae
standard
3.3823794
2023-08-04
2394
rmse
standard
4.1438817
2023-08-04
2394
rsq
standard
0.2726845
2023-08-04
2394
mae
standard
3.3005535
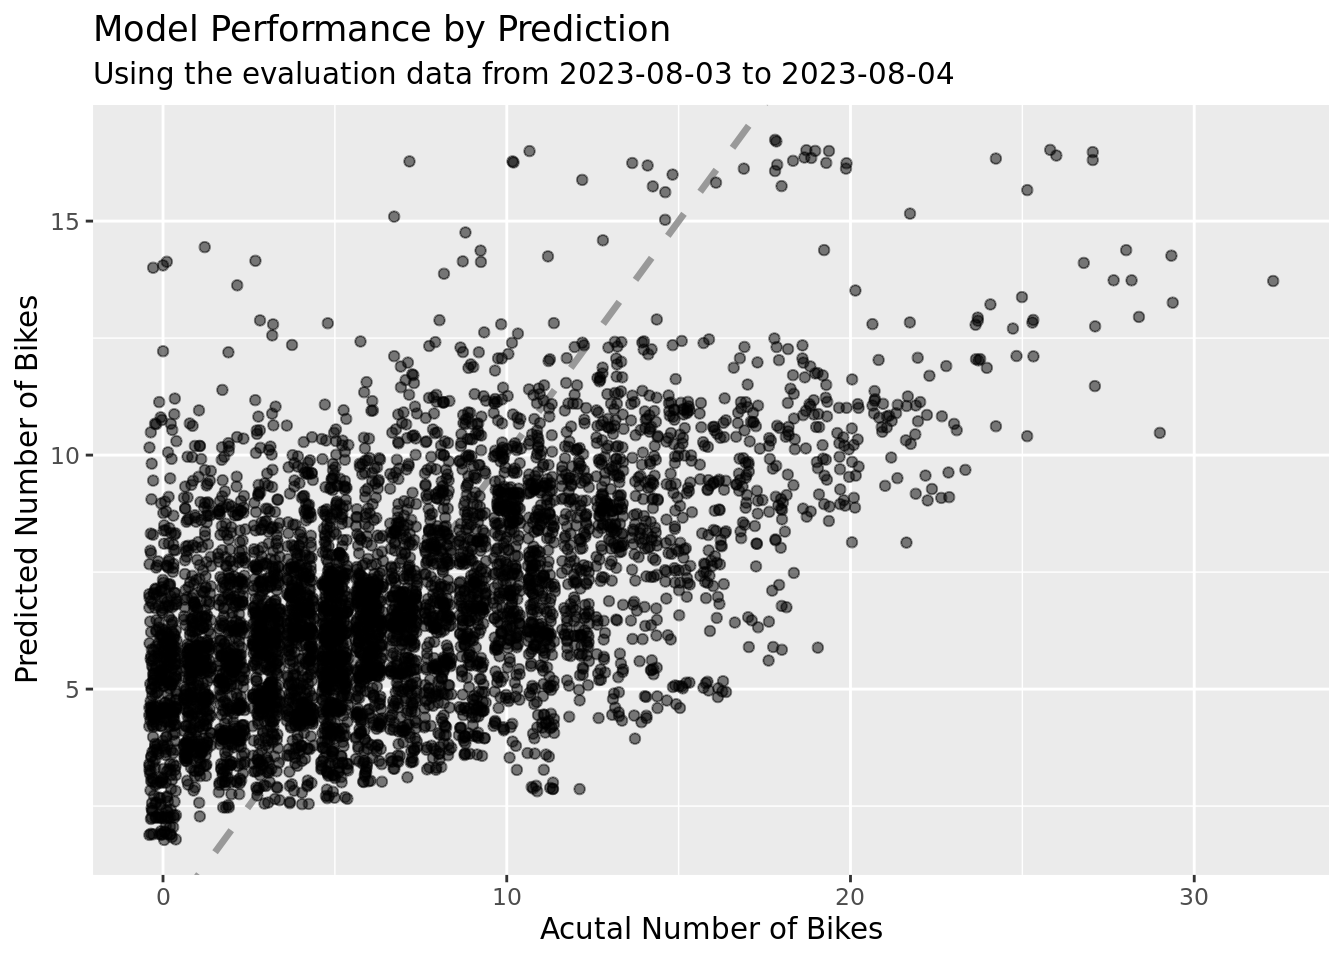
A comparison of the model prediction vs. the ground truth for the model evaluation data.
Code
preds %>%ggplot(aes(n_bikes, .pred)) +geom_abline(slope =1, lty =2, color ="gray60", size =1.2) +geom_jitter(alpha =0.5, width =0.4) +labs(title ="Model Performance by Prediction",subtitle =glue("Using the evaluation data from {test_start_date} to {test_end_date}"),x ="Acutal Number of Bikes",y ="Predicted Number of Bikes" )
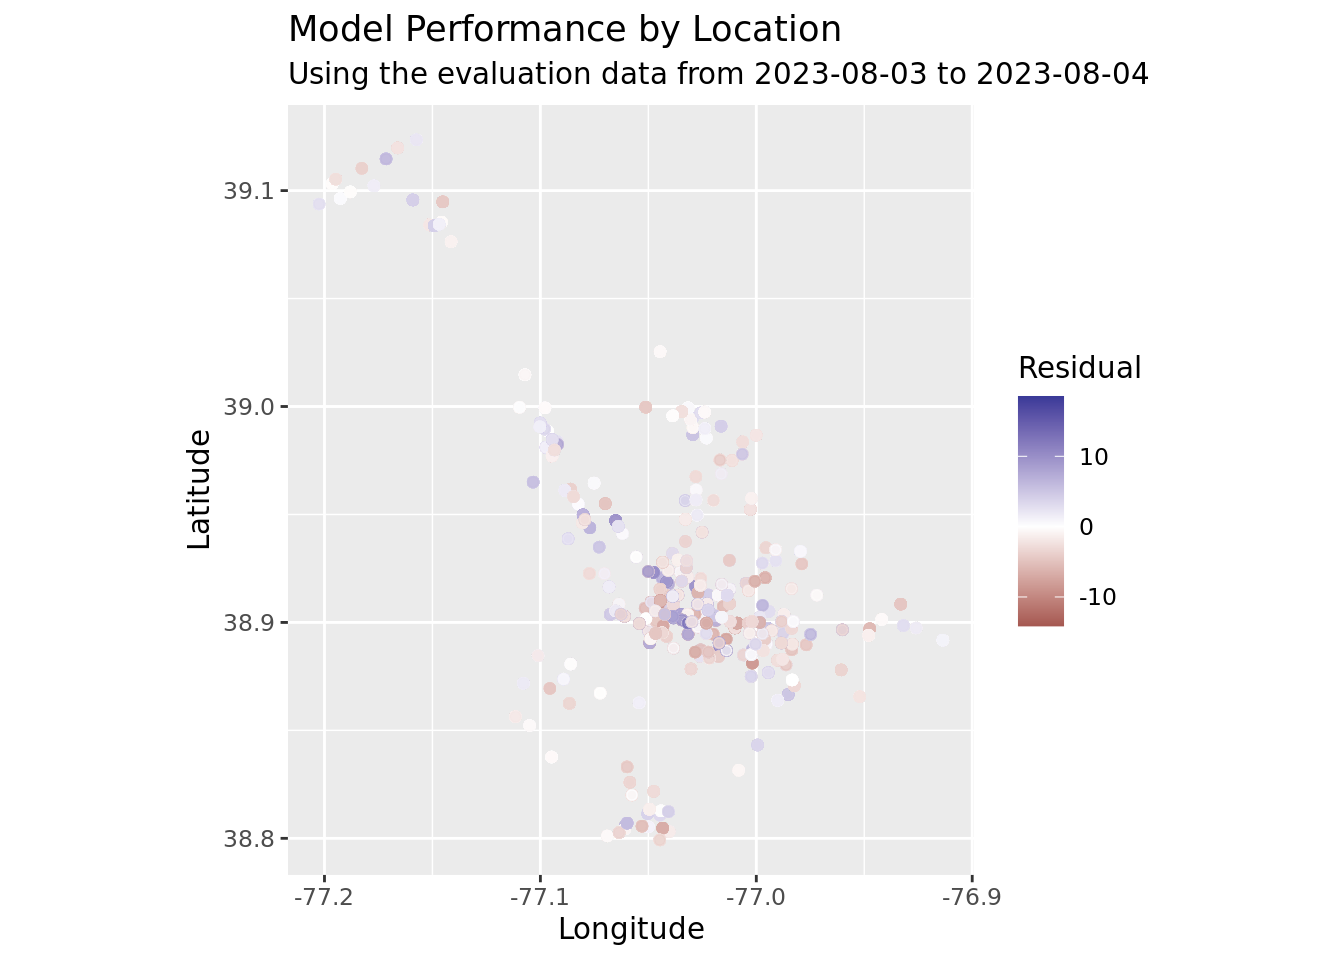
A visual assessment of model performance by location.
Code
preds %>%mutate(.resid = n_bikes - .pred) %>%ggplot(aes(lon, lat, color = .resid)) +geom_point(alpha =0.8) +scale_color_gradient2() +coord_fixed() +labs(title ="Model Performance by Location",subtitle =glue("Using the evaluation data from {test_start_date} to {test_end_date}"),x ="Longitude",y ="Latitude",color ="Residual" )
Ethical considerations
We considered the ethical impact the use of the model may have. We assessed that the overall risk due to an incorrect model prediction is relatively low.
Caveats & recommendations
This model does not guarantee that a bike will be available at a station.
We recommend using this model for demonstration purposes only.
---title: "Model Step 2 - Model Card"date: "`r lubridate::date(lubridate::now(tzone = 'EST'))`"format: html: code-fold: true code-tools: source: true toggle: trueparams: name: sam.edwardes/bike_predict_model_r version: NULL---## BackgroundA [model card](https://doi.org/10.1145/3287560.3287596) provides brief, transparent, responsible reporting for a trained machine learning model. Expand the code chunk below to inspect the code that loads the model, training data, and evaluation data.```{r setup}#| collapse: truelibrary(tidyverse)library(vetiver)library(pins)library(yardstick)library(glue)library(kableExtra)board <- pins::board_rsconnect()v <-vetiver_pin_read(board, params$name, version = params$version)v_meta <-pin_meta(board, params$name)con <- odbc::dbConnect(odbc::odbc(), "Content DB", timeout =10)bike_model_data <-tbl(con, "bike_model_data")train_start_date <- lubridate::as_date(v$metadata$user$train_dates[1])train_end_date <- lubridate::as_date(v$metadata$user$train_dates[2])test_start_date <- lubridate::as_date(v$metadata$user$test_dates[1])test_end_date <- lubridate::as_date(v$metadata$user$test_dates[2])data <- bike_model_data %>%filter(date >= train_start_date) %>%collect() %>%mutate(data_type =case_when( date <= train_end_date ~"train", date <= test_end_date ~"test",TRUE~"latest" ) )train_data <- data %>%filter(data_type =="train")test_data <- data %>%filter(data_type =="test")```## Model details- Developed by Sam Edwardes (RStudio - Solutions Engineer)- `r cli::pluralize("{v$description} using {ncol(v$ptype)} feature{?s}")`- This model was developed to predict how many [capital bikeshare](https://capitalbikeshare.com) bikes will be available for a given station based on the time of day, and day of the week.- The data used to train the model was obtained from the [capital bikeshare API](https://ride.capitalbikeshare.com/system-data).- Version `r v$metadata$version` of this model was published at `r v_meta$created`- If you have questions about this model, please create an issue on our GitHub repo: <https://github.com/sol-eng/bike_predict/issues>.## Intended use- The primary intended use of this model is to demonstrate an end-to-end data science workflow using [RStudio Connect](https://www.rstudio.com/products/connect/).## Metrics- The metrics used to evaluate this model are: - Root Mean Squared Error (RMSE), - R Squared (RSQ), and - Mean Absolute Error (MAE).- We chose these metrics because because they are the most common metrics for assessing the performance of regression models, and that they are well understood by the data science community.## Training data & evaluation data::: {.panel-tabset}### OverviewThe training data set for this model was was obtained from the [capital bikeshare API](https://ride.capitalbikeshare.com/system-data). The Model is retrained on a daily basis using refreshed data.- Training date range: `r train_start_date` to `r train_end_date`.- Evaluation date range: `r test_start_date` to `r test_end_date`.The data set for this model has the "prototype" or signature:```{r view_prototype}glimpse(v$ptype)```### Training dataBelow is a summary of the training data:```{r skim_train_data}train_data %>%select(-n_bikes) %>% skimr::skim()```### Evaluation dataBelow is a summary of the evaluation data:```{r skim_test_data}test_data %>%select(-n_bikes) %>% skimr::skim()```:::## Quantitative analyses ::: {.panel-tabset}```{r compute_predections}#| collapse: true# compute predictions for your evaluation data# `handler_startup` is designed to get the R process ready to make predictionssuppressPackageStartupMessages(handler_startup(v))# Specifically load the packages required by the model. Check # `v$metadata$required_pkgs` to see the required packages. These packages must# be specifically defined so that RStudio Connect knows to install them when# deploying this document.library(parsnip)library(ranger)library(recipes)library(workflows)preds <-augment(v, test_data)latest_metrics <- preds %>%arrange(date) %>%vetiver_compute_metrics(date_var = date,period ="day",truth = n_bikes,estimate = .pred )```### Overall model performanceOverall model performance against the model evaluation data.```{r view_latest_metrics}#| collapse: true# Explicitly define packages used for model metrics by vetiver so that Connect # is able to redeploy.library(slider)latest_metrics %>%kable() %>%kable_material()```### Visualize model performanceA comparison of the model prediction vs. the ground truth for the model evaluation data.```{r preds_plot}preds %>%ggplot(aes(n_bikes, .pred)) +geom_abline(slope =1, lty =2, color ="gray60", size =1.2) +geom_jitter(alpha =0.5, width =0.4) +labs(title ="Model Performance by Prediction",subtitle =glue("Using the evaluation data from {test_start_date} to {test_end_date}"),x ="Acutal Number of Bikes",y ="Predicted Number of Bikes" )```### Performance by locationA visual assessment of model performance by location.```{r preds_lat_lon_plot}preds %>%mutate(.resid = n_bikes - .pred) %>%ggplot(aes(lon, lat, color = .resid)) +geom_point(alpha =0.8) +scale_color_gradient2() +coord_fixed() +labs(title ="Model Performance by Location",subtitle =glue("Using the evaluation data from {test_start_date} to {test_end_date}"),x ="Longitude",y ="Latitude",color ="Residual" )```:::## Ethical considerations- We considered the ethical impact the use of the model may have. We assessed that the overall risk due to an incorrect model prediction is relatively low.## Caveats & recommendations- This model does not guarantee that a bike will be available at a station.- We recommend using this model for demonstration purposes only.- To see the raw source code that produced this document visit <https://github.com/sol-eng/bike_predict/blob/main/content/02-model/02-model-metrics/document.qmd>.